on
Sentry for Spring Boot, a tutorial
Sentry is a performance monitoring and error tracking platform that helps developers identify, diagnose and fix failures in their applications. Its main functionality is to display application errors in an aggregated way, so that the team responsible for the system can have an idea of the errors that most affect the system, as well as the distribution of these errors over time.
![]()
But Sentry also has a distributed tracing functionality, which rivals some of the solutions, such as Jaeger, OpenZipkin and Grafana Tempo. In order to later be able to establish a comparison between these solutions, especially regarding support for distributed trace analysis, I decided to first understand Sentry in more depth, knowing all the potential benefits it can bring.
One motivation for publishing this tutorial was the scarcity of resources about Sentry, including good videos on YouTube. In addition, I noticed some relevant omissions and inaccuracies in the official Sentry documentation.
What we won’t cover here: basic concepts about distributed tracing.
So let’s go!
Scenario
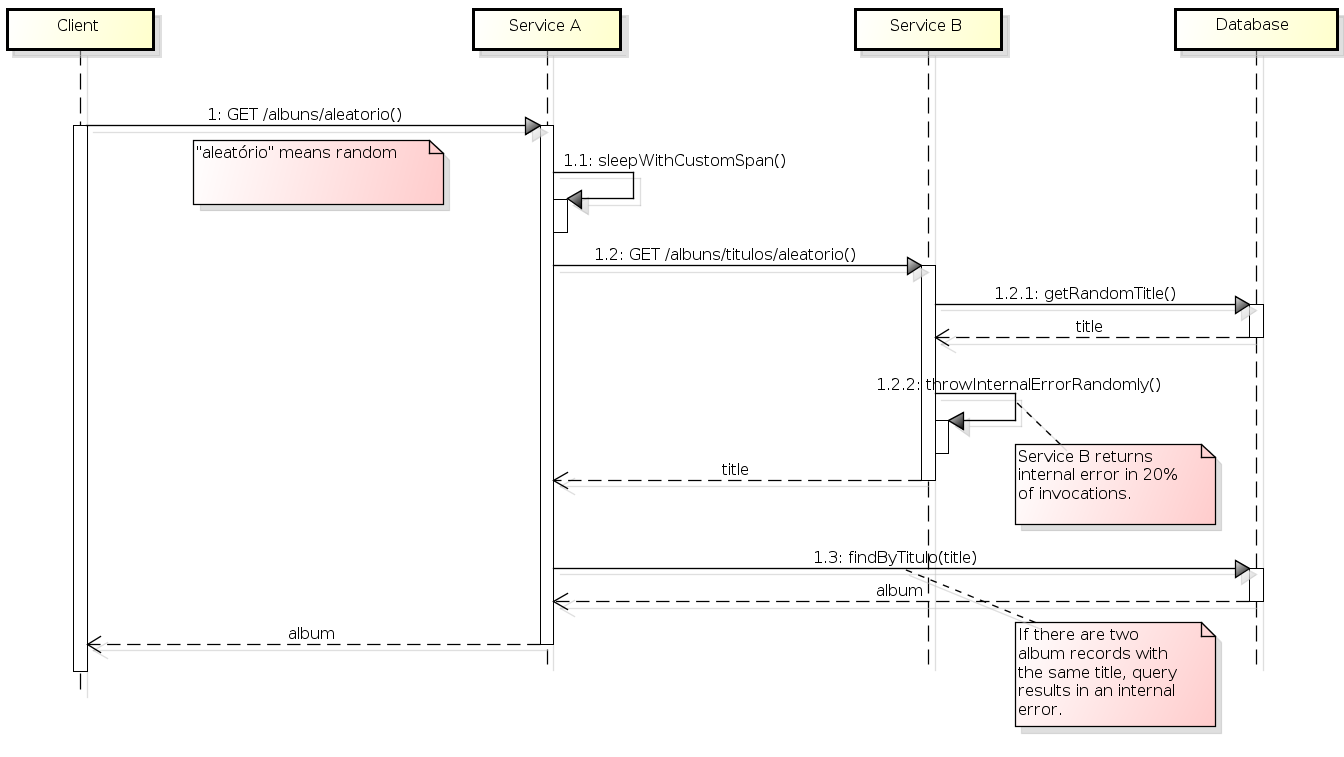
For a good analysis of Sentry’s functionalities, especially in relation to the distributed trace, it is necessary to set up a suitable scenario for such analysis, involving at least two services. We then set up a scenario with services A and B according to the following flow:
- When called, service A first pauses for 1 second, thus simulating some heavy processing.
- Service A calls service B to get a random album title.
- Service B gets the random title from the database and returns it to service A.
- Service A gets the complete album, searching for the album by title in the database.
- Some albums are duplicated in the table. If service B returns a title from one of these duplicated albums, there will be an internal error in service A (which is interesting for monitoring).
- Sometimes service B also returns an internal error randomly (20% of the times it is called). When receiving an internal error from B, service A also responds with an internal error.
The above description is represented below as a sequence diagram:
The source code for these services, already instrumented by Sentry, is available at https://gitlab.com/leo-observability-labs/sentry-lab.
Note: the version of Spring Boot used is 3.4.1.
Initial setup
First, we created two Sentry projects on https://sentry.io: the servico-a project and the servico-b project. When creating a project, Sentry displays a page on how to perform the basic configurations, which are as follows.
In build.gradle:
plugins {
  id "io.sentry.jvm.gradle" version "4.14.1"
}

sentry {
  includeSourceContext = true
  org = "leite-oe"
  projectName = "servico-a"
  authToken = System.getenv("SENTRY_AUTH_TOKEN")
}
In application.properties:
sentry.dsn=https://ac25fa38da889012dc40717e0e32b071@o4508698572029952.ingest.us.sentry.io/450875676046XYZX
sentry.traces-sample-rate=1.0
Place the Sentry.captureException(e) in exception handler:
@ControllerAdvice
@Log4j2
public class ServiceAExceptionHandler {

    @ExceptionHandler(RuntimeException.class)
    public ResponseEntity<InternalErrorMessage> runtimeException(RuntimeException e, HttpServletRequest request) {

        log.error("Unexpected error: " + e.getMessage(), e);

        Sentry.captureException(e);

        InternalErrorMessage msg = new InternalErrorMessage();
        return ResponseEntity.status(HttpStatus.INTERNAL_SERVER_ERROR.value()).body(msg);
    }

}
To start the service, we also created a script (where the value of SENTRY_AUTH_TOKEN is provided by the project’s initial configuration page):
set -e # stop script if any command fails
clear
export SENTRY_AUTH_TOKEN=sntrys_eyJpYXQiOjE3Mzg2MDgwOTYuNDkzNDMsInVybCI6Imh0dHBzOi8vc2VudHJ5LmlvIXYZX
./gradlew clean build
java -jar build/libs/serviceA-0.0.1-SNAPSHOT.jar
The above steps were applied to both service A and service B.
Inter-service invocation
In order for the trace view to work properly, care must be taken. When using RestTemplate to invoke another service (in this case A calling B), the restTemplate object must have been created from a RestTemplateBuilder provided by the framework. In other words, do not instantiate restTemplate with new! To do this, we created the AppConfig class as a restTemplate factory:
@Configuration
public class AppConfig {

    @Bean
    RestTemplate restTemplate(RestTemplateBuilder builder) {
        return builder.build();
    }

}
And where restTemplate is used, just inject it:
@RestController
@Log4j2
public class ServiceAController {

    @Autowired
    private RestTemplate restTemplate; // and then, ust use it

    // ....

    private String accessAnotherService() {
        String url = "http://localhost:8092/service-b/albuns/titulos/aleatorio";
        try {
            ResponseEntity<String> response = restTemplate.getForEntity(url, String.class);
            return response.getBody();
        } catch (HttpStatusCodeException e) {
            throw new IllegalStateException("Failed to get random album title from service B");
        }
    }
}
This way, the propagation of the trace ID generated by Sentry instrumentation will be performed automatically.
Custom span
To highlight a code snippet in the Sentry trace as a span, we can do the following:
var activeTransaction = Sentry.getSpan();
var span = activeTransaction.startChild("Dormindo", "app.logic"); // "Dormindo" means sleeping

try {
    Thread.sleep(1000);
    span.finish(SpanStatus.OK);
} catch (InterruptedException e) {
    span.finish(SpanStatus.INTERNAL_ERROR);
    throw new IllegalStateException("Nunca deveria acontecer enquanto dormindo.", e);
}
We put the snippet above at the beginning of the processing of Service A.
Database in Sentry
According to the Sentry documentation, its JDBC integration creates a span for each JDBC statement executed. Turning database calls into Sentry spans is fantastic for identifying which database calls are our performance bottlenecks.
To do this, we first changed build.gradle by adding the following dependency:
implementation 'io.sentry:sentry-jdbc:7.18.0'
Next, we also changed application.properties:
#spring.datasource.url=jdbc:postgresql://localhost:58432/sentry-lab?ApplicationName=service-b
#spring.datasource.driver-class-name=org.postgresql.Driver
spring.datasource.url=jdbc:p6spy:postgresql://localhost:58432/sentry-lab?ApplicationName=service-b
spring.datasource.driver-class-name=com.p6spy.engine.spy.P6SpyDriver
Finally, to avoid generating log files locally, we created the file src/main/resources/spy.properties:
modulelist=com.p6spy.engine.spy.P6SpyFactory
This was done basically following the Sentry documentation on JDBC integration, but with some catches: the version of sentry-jdbc compatible with the project’s Spring Boot version was not 8.0.0. To avoid local logs, the documentation suggests two options (creating spy.properties or changing application.properties), but only one of them worked (spy.properties).
Integration with logs
In Sentry, logs are linked to captured errors. This is already done by default. To demonstrate this, we created a log record at the beginning of the execution of each of our service operations, as follows:
import lombok.extern.log4j.Log4j2;

@RestController
@Log4j2
public class ServiceAController {

    // ...

    @GetMapping("/albuns/aleatorio")
    public Album hello() {

        log.info("Something quite interesting seemed to have happened here...");
According to the documentation and tutorials on the Internet, there is an idea that the io.sentry:sentry-logback:7.18.0 dependency would bring more details to the breadcrumb that makes up the details of an error in Sentry. But at least in our case, we did not observe any apparent effect, so we chose not to use this dependency.
Results in Sentry
View of captured errors
Below we have the view of Sentry issues:
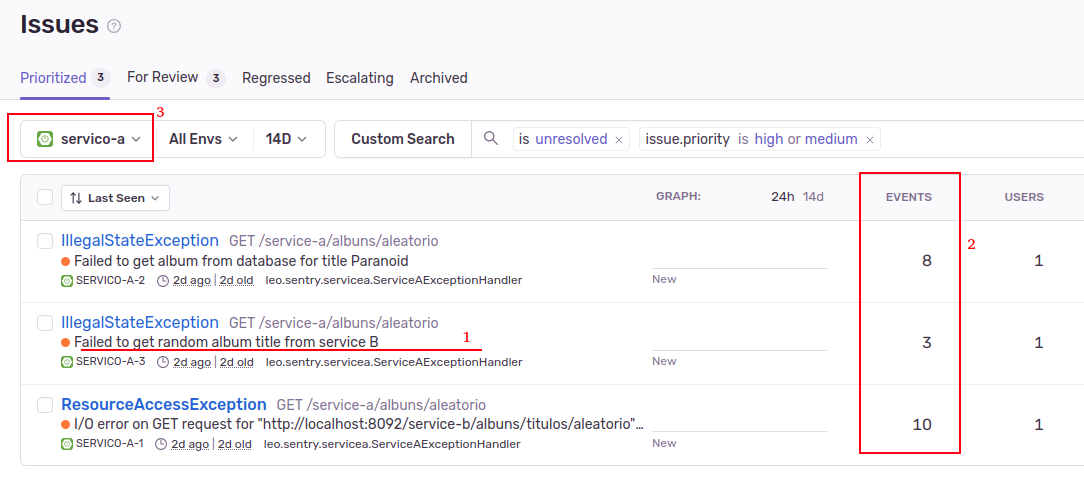
On this screen (Figure 2), we can see:
- The different errors occurring in our system.
- The quantity of these errors. In addition, it is also possible to see whether a given error is affecting many users or just a few. These questions are important to help prioritize the treatment of these errors.
- It is possible to filter the errors by module (service); this is important because it helps each team to focus on their problems.
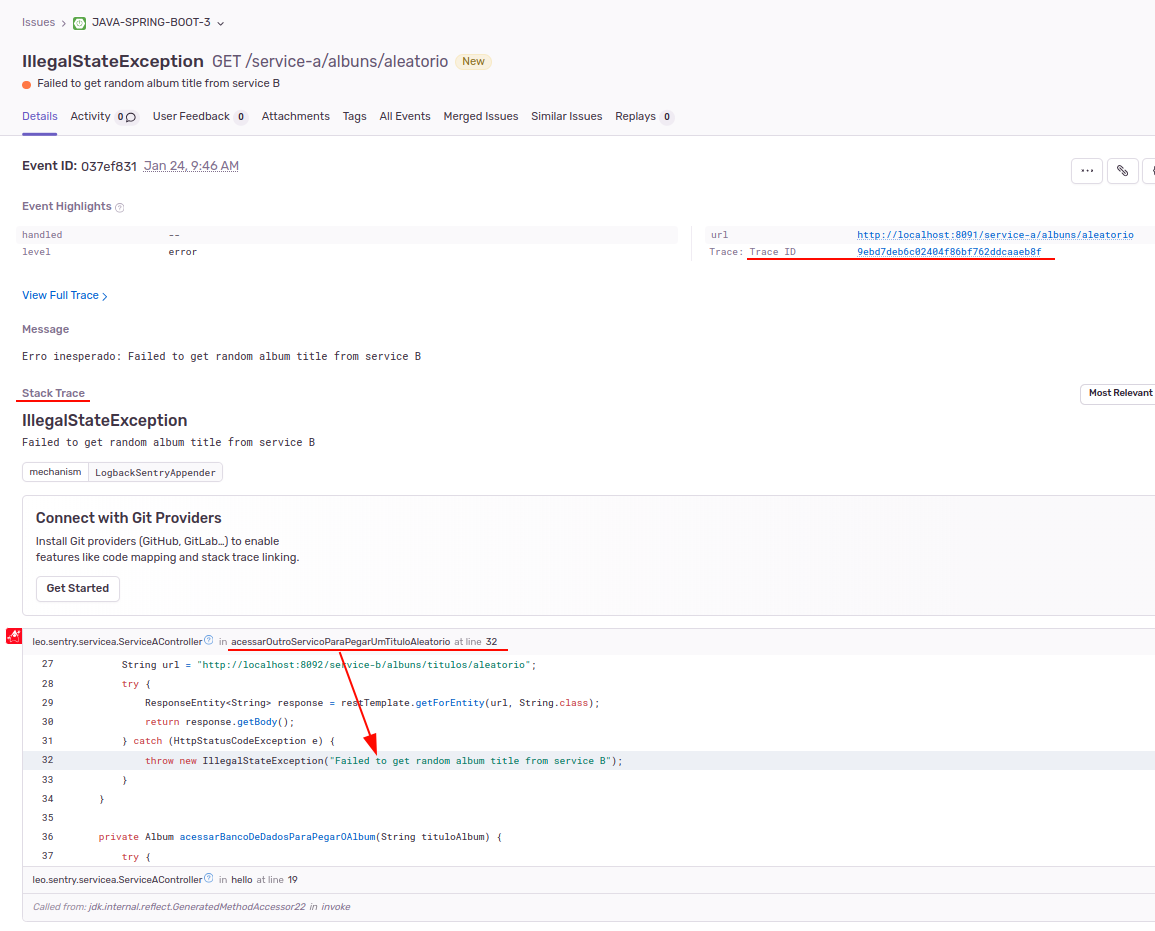
For each occurrence of each error, we have a screen with the error details:
In this same view, we also have a breadcrumb that displays the logs that occurred during the execution that generated the error:
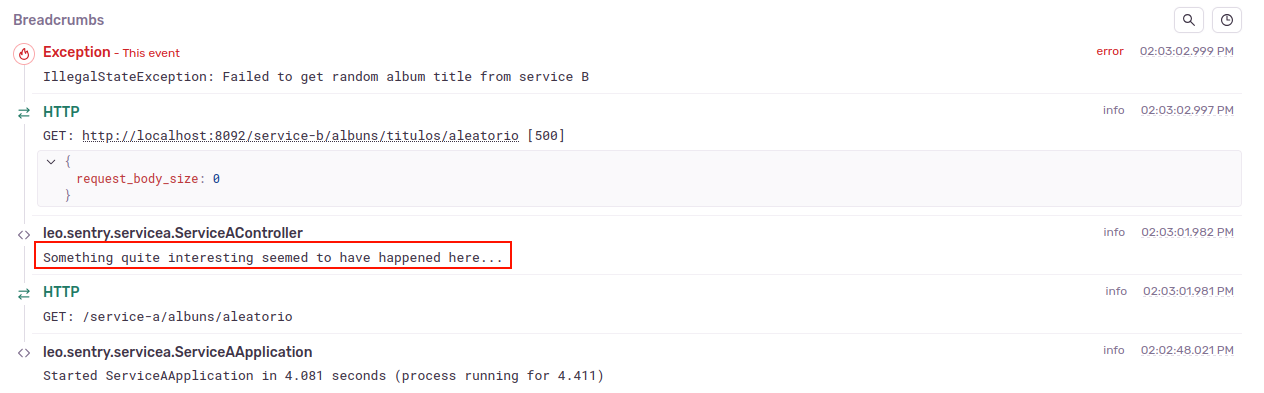
An observation: the error is associated with a module, so the stack trace and the breadcrumb will only mention events within the module. In other words, for an error associated with service A, the stack trace will not show the error lines from service B and the breadcrumb will not show the logs recorded by service B.
Distributed trace view
And this is the amazing distributed trace view that Sentry provides us:
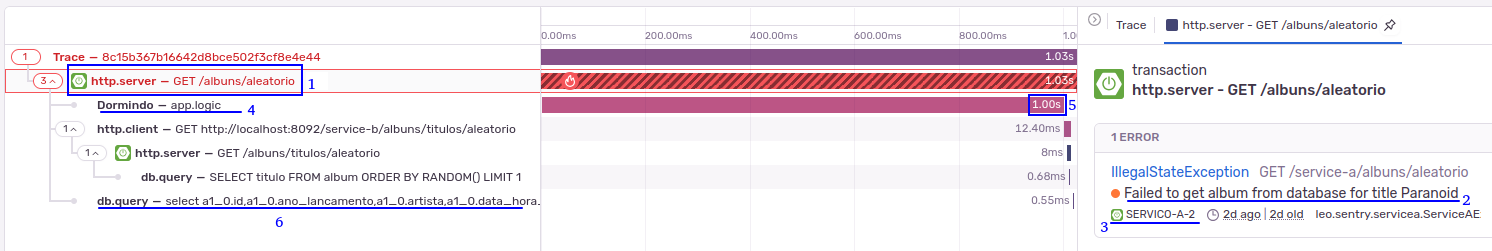
In this view (Figure 5), we see the spans that make up the trace, and the spans of all services involved in that distributed transaction (identified by a trace ID) are displayed. In addition, we can see that:
- We can select the different spans that make up the trace.
- The interface displays the error associated with that span.
- The interface displays the module (service) in which the selected span was executed.
- We can also see the custom spans.
- We have the execution time of each span. In the case of the “dormindo” span, which was a custom span, we have a time of just over 1 second, which was expected since in this span we executed the command
Thread.sleep(1000);. - And we also have the spans of accesses to the database, including the SQL query performed.
Finding a trace in Sentry by trace ID
Given a trace ID (e.g.: eb30841f72144188abc3cea2592265db), we can find its corresponding trace in Sentry using the filter trace:eb30841f72144188abc3cea2592265db in the search bar of some screens, such as the issues screen and the performance screen. It was supposed to work on the traces screen, but it didn’t.
One project per service vs. one project for all services
In this tutorial, we used the configuration of one Sentry project per service. As we can see from the results obtained (Figures 2 to 5), in this option we have an integrated view of the distributed trace. At the same time, it is very easy to observe only the errors of a specific service. Furthermore, in the distributed trace view we have clarification about which service each span refers to. In other words, excellent.
But we also tried the strategy of using a single Sentry project for different services. However, this strategy presented drawbacks and no particular advantages (except for greater ease of configuration). In this option, in some contexts there is no practical way to filter items by module or identify the module associated with an item. In other words, in a situation where different teams take care of different modules, it will probably be difficult to “let me see only the things from my team here”.
Therefore, we recommend configuring a Sentry project per service (i.e., system module).
Sentry trace ID in logs and in internal error message
When a request is made to an “edge service” of our system, Sentry instrumentation generates a trace ID for that distributed transaction. From that point on, this trace ID is automatically propagated through the system services. However, using this trace ID is more effective if we do two more things: 1) print this trace ID in each log record and 2) return this trace ID in internal error messages (so that tickets can be opened with the client providing us with the trace ID).
To put the trace ID in the log, we first capture the trace ID from Sentry and make it available to the log in the “MDC context”:
@Component
@Order(1)
public class TraceIdFilter implements Filter {

    public void doFilter(ServletRequest servletRequest, ServletResponse servletResponse, FilterChain chain)
            throws IOException, ServletException {

        String traceId = Sentry.getSpan().getSpanContext().getTraceId().toString();
        TraceIdManager.configurarTraceId(traceId);

        chain.doFilter(servletRequest, servletResponse);
    }
}

public class TraceIdManager {

    private static final String MDC_KEY = "traceId";

    public static void configurarTraceId(String traceId) {
        if (StringUtils.isNotBlank(traceId)) {
            MDC.put(MDC_KEY, traceId);
        }
    }

    public static String getTraceId() {
        return MDC.get(MDC_KEY);
    }
}
Now, for the trace ID to appear in the log, we have to configure the log in application.properties:
logging.pattern.console=%d{yyyy-MM-dd HH:mm:ss} %-5level %logger Trace ID: %X{traceId} - %msg%n
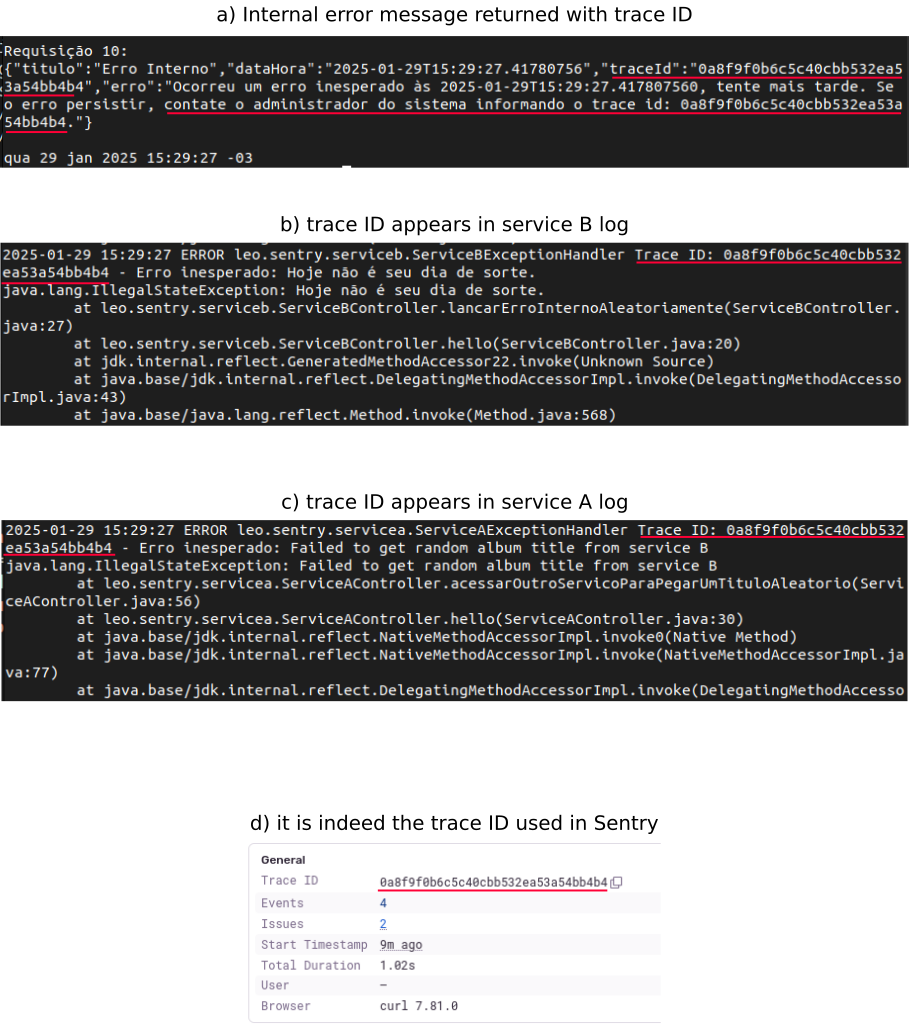
And for the trace ID to also be returned in the internal error message:
@Data
public class InternalErrorMessage {

    private final String title = "Internal error";
    private final LocalDateTime dateHour = LocalDateTime.now();
    private final String traceId = TraceIdManager.getTraceId();
    private final String error = "An unexpected error occurred at " + dateTime
        + ", please try again later. If the error persists, contact your system administrator and provide the trace ID: "
        + traceId + ".";
}
So, when an internal error occurs in service B, we see the trace ID in the internal error message we receive from Service A, as well as in the logs of both services:
Resilience and performance concerns
Consider the Sentry.captureException(e) command in the exception handler. At this point, the Sentry client (in our application) sends an event to the Sentry server. What happens if this communication is slow? Will it slow down our application? What happens if this communication fails? Will events be lost? In short, how does Sentry handle performance and resilience issues?
Well, Sentry has mechanisms to deal with these issues:
- Event Queue: Sentry uses an event queue (in memory) to temporarily store events that could not be sent immediately. If there is a network problem, the events will be stored in the queue and sent as soon as the connection is reestablished.
- Timeouts and performance: Sentry is configured not to block the application. It uses timeouts to ensure that the application is not significantly slowed down due to communication problems with the Sentry server.
- Cache: The Sentry SDK caches events locally on disk when it is not possible to send them immediately to the Sentry server, for example, due to network connectivity problems. These cached events will be sent as soon as connectivity is reestablished. The use of cache in Sentry is enabled by default.
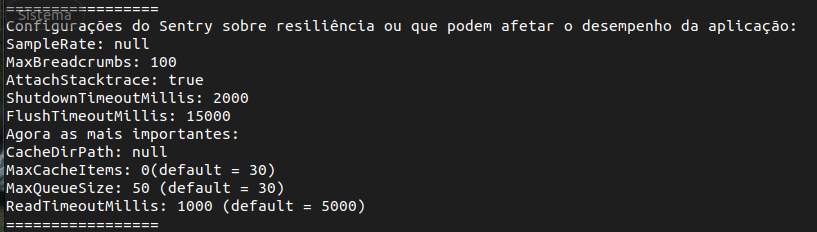
There are some Sentry client settings that influence the behavior of the mechanisms listed above. We thought it would be a good idea to customize the following (application.properties):
sentry.max-queue-size=50 # default 30
sentry.read-timeout-millis=1000 # default 5000
sentry.max-cache-items=0 # default 30
- Increasing the queue size (
max-queue-size) increases resilience (i.e., it helps prevent Sentry events from being lost), although it will cost more memory. - Decreasing the communication timeout with the Sentry server (
read-timeout-millis) reduces application slowdowns in the event that this communication is not possible (although it may fill the queue with more events and, therefore, eventually contribute to event loss). - We have disabled the use of the cache (
max-cache-items) considering that the application will be executed in a Docker container without volume mapping for the directory of this cache (situation in which the cache would be useless, so it is better to eliminate its use and thus reduce the overhead of using Sentry).
The image below shows the settings used:
To print these properties:
public class SentryResilieConfiguration {

    public static void print() {
        System.out.println("=================");
        System.out.println("Sentry settings about resilience or that may affect application performance:");
        SentryOptions options = Sentry.getCurrentHub().getOptions();
        System.out.println("SampleRate: " + options.getSampleRate());
        System.out.println("MaxBreadcrumbs: " + options.getMaxBreadcrumbs());
        System.out.println("AttachStacktrace: " + options.isAttachStacktrace());
        System.out.println("ShutdownTimeoutMillis: " + options.getShutdownTimeoutMillis());
        System.out.println("FlushTimeoutMillis: " + options.getFlushTimeoutMillis());
        System.out.println("Agora as mais importantes:");
        System.out.println("CacheDirPath: " + options.getCacheDirPath());
        System.out.println("MaxCacheItems: " + options.getMaxCacheItems() + " (default = 30)");
        System.out.println("MaxQueueSize: " + options.getMaxQueueSize() + " (default = 30)");
        System.out.println("ReadTimeoutMillis: " + options.getReadTimeoutMillis() + " (default = 5000)");
        System.out.println("=================");
    }
}

@SpringBootApplication
public class ServiceBApplication {

    @EventListener(ContextRefreshedEvent.class)
    public void onApplicationEvent() {
        SentryResilieConfiguration.print();
    }

    public static void main(String[] args) {
        SpringApplication.run(ServiceBApplication.class, args);
    }
}
Conclusions
We configured our Spring Boot services to work with Sentry as-a-service (https://sentry.io), so we were able to:
- identify application errors in Sentry,
- link the source code to the stack trace,
- see log records in the context of each error,
- have beautiful distributed trace visualizations,
- create custom spans in these traces,
- transform database accesses into spans in Sentry,
- show the trace ID generated by Sentry in our log messages,
- return this same trace ID in our internal error messages and
- configure properties that reinforce the resilience and performance aspects of communication with the Sentry server.
We experimented with configuring a single Sentry project for all modules (services) in the system and configuring a project for each module. We concluded that configuring a project per module is more appropriate: it is easy to filter errors from a given module without losing the integrated view of the distributed trace.
One caveat: Sentry is not designed to be used to audit requests. Although it seems possible to work around it, at first we do not have the request body and the response body of each invocation in Sentry. Furthermore, the recommendation for production is not to keep the traces of all invocations (inadequate for auditing), which also brings us to the next point.
Open questions
It may be an impression, but it seems that Sentry is more recognized for being a tool for analyzing errors (as we said, the quantitative aggregation of errors that Sentry does is quite valuable). However, its use as a tracing tool seems somewhat neglected by the community.
Sentry itself indicates that the sentry.traces-sample-rate property should not be set to 1.0 in production. In other words, in production we would not have a distributed trace of all system executions (although we might have all the traces of the executions involved in errors). I wonder if this would be enough in production to handle the necessary analyses to be performed in case of complaints of slowness in the system. Perhaps a workaround would be to capture all traces for only a short period of time in certain situations.
I haven’t yet used Sentry’s distributed trace functionality in production. Therefore, I don’t have answers to the concerns mentioned above. However, I know that when we talk about distributed traces, names like Jaeger and Open Zipkin seem to be more consolidated. And then there’s Grafana Tempo, which seems to be very promising because it make explicit its concerns with performance and scalability for capturing all traces of the system.
PS: Other Sentry features
Since we only ran the demo services on localhost, we didn’t explored some Sentry features that are harder to evaluate in this context. But it’s worth mentioning two important capabilities that Sentry offers:
- In the
application.propertiesfile you can configure thesentry.environmentproperty (example value:production). This makes it possible to filter Sentry events by environment. - In the
application.propertiesfile you can configure thesentry.releaseproperty, and one of the recommended strategies is to fill this property with the hash of the commit that is being published (example:da39a3ee5e6b4b0d3255bfef95601890afd80709). This way, we can get an idea of which version of the code may have caused, for example, an increase in a certain type of error.