on
Distibuted tracing with Spring Boot and OpenTelemetry, a tutorial
OpenTelemetry (Otel) is an open source project that provides a standardized set of tools, APIs, and SDKs for distributed application observability. It allows you to collect, process, and export metrics, logs, and traces to other tools (Prometheus, Jaeger, Grafana Tempo, etc.), making it easier to monitor and detect problems in complex systems.
![]()
In this post, we will focus on the distributed trace view that we can have in tools like Jaeger thanks to the instrumentation performed by OpenTelemetry. To do this, we will see how to instrument a Spring Boot application and the advantages that can be gained from it.
What we will not cover here: basic concepts about distributed traces. For this, you can check out this another post of ours about distributed trace.
So, let’s go!
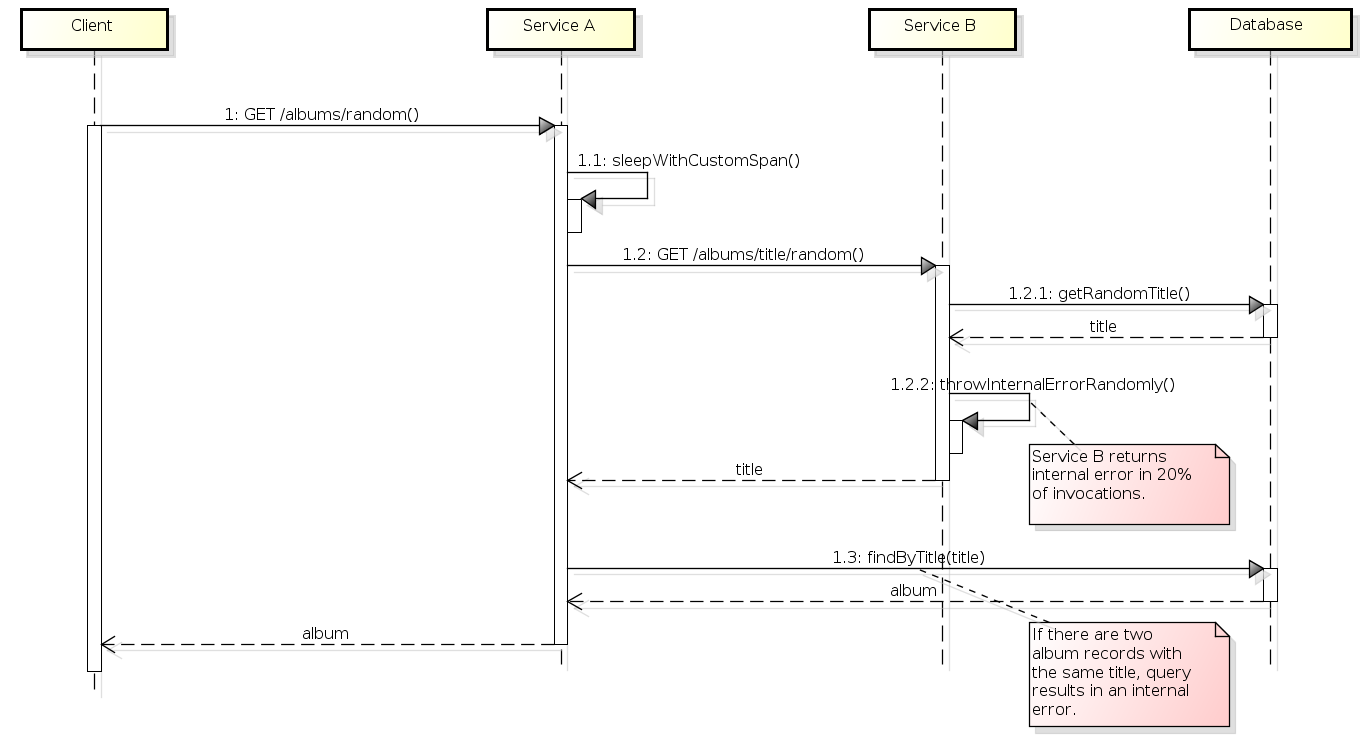
Scenario - instrumented services
For a good evaluation of a distributed tarce solution, it is necessary to set up a suitable scenario for such analysis, involving at least two services. We then set up a scenario with services A and B according the following flow:
- When invoked, service A first pauses, thus simulating some longer processing.
- Service A calls service B to get a random album title.
- Service B gets the random title from the database and returns it to service A.
- Service A gets the complete album, searching for the album by title in the database.
- Some albums are duplicated in the table. If Service B returns a title from one of these duplicate albums, there will be an internal error in Service A (which is interesting for monitoring).
- Sometimes Service B also returns an internal error randomly (20% of the times it is called). When Service A receives an internal error from B, it also responds with an internal error.
The above description is represented below as a sequence diagram:
TODO translate figure
The source code for these services, already instrumented with OpenTelemetry, is available at https://gitlab.com/leo-observability-labs/otel-lab.
Note: the version of Spring Boot used is 3.4.1.
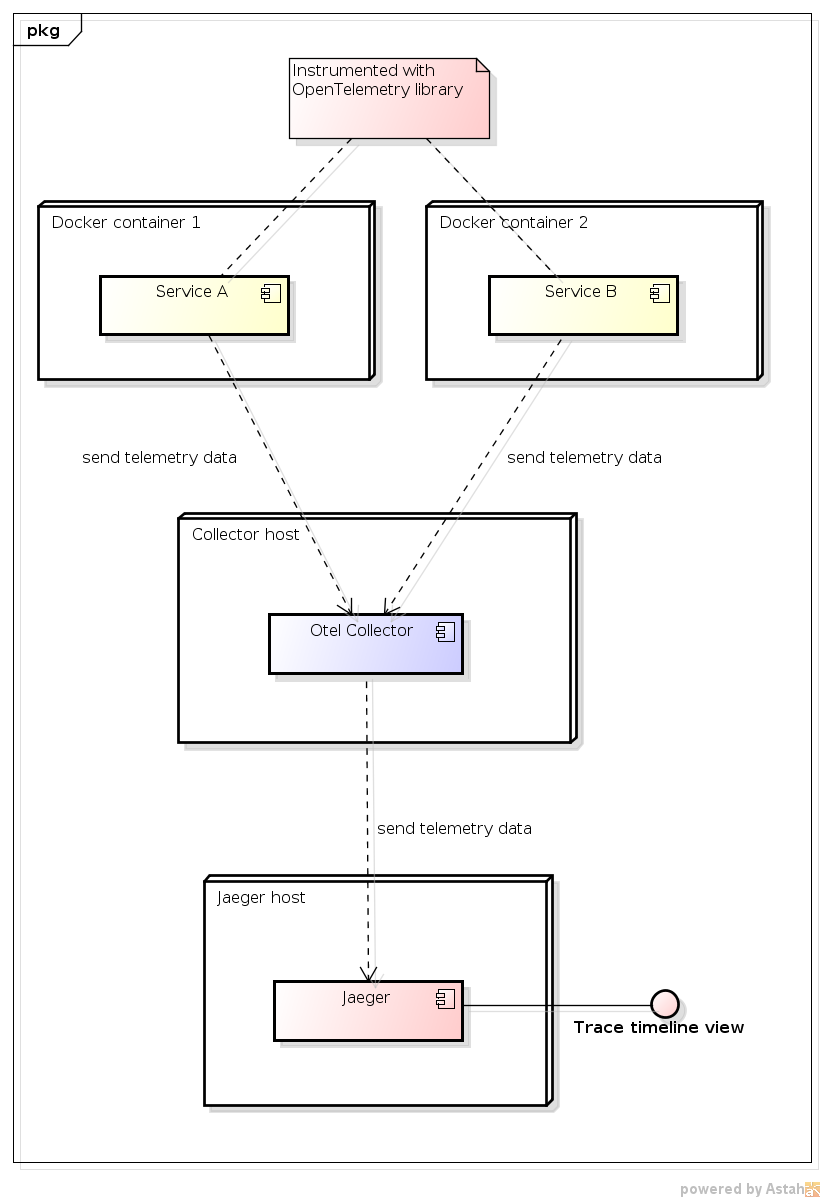
Infrastructure setup - OpenTelemetry Collector and Jaeger
It is possible to instrument a Spring Boot application without changing its code at all by using an agent that runs in conjunction with the application (i.e., the agent is a separate jar that runs in the same container as the application, which is also called a sidecar). However, we will not use this approach; we will change the code to perform the instrumentation.
An instrumented application can send data directly to what is called a backend, which are the various tools that will actually present the telemetry to users. However, it is possible to have an intermediary infrastructure entity, which is the OpenTelemetry Collector. Its use is recommended and we will discuss why in more detail later. This Collector can be run on the instrumented service host or on a separate server. In our case, for the demonstration, everything will be run on localhost. However, the idea is that in production the Collector would run on a dedicated remote host.
Note: the choices of instrumenting the application with code changes and considering the Collector on a remote host were made based on the most viable possibilities in my workplace.
Finally, in order to validate that the instrumentation is occurring as desired, we need a visualization tool. We will use Jaeger here, but without prejudice to other possible options, such as Grafana Tempo.
With these considerations, the view we have of the production infrastructure involved in the use of OpenTelemetry is as follows:
For the demonstration, the Collector and Jaeger will be in Docker containers running on localhost. Here is the fragment of docker-compose.yml responsible for this:
  otel-collector:
    image: otel/opentelemetry-collector-contrib:0.121.0
    ports:
# Instrumented application sends data through one of the ports below:
      - "4317:4317" # grpc
      - "4318:4318" # http
    volumes:
      - ./otel-collector-config.yml:/etc/otel-collector-config.yml
    command: ["--config=/etc/otel-collector-config.yml"]
    depends_on:
      - jaeger

  jaeger:
    image: jaegertracing/jaeger:2.4.0
    ports:
      - "16686:16686" # web interface: http://localhost:16686
# Ports below are blocked to avoid conflicts with Collector ports
# Note: exposure is not necessary for access from another container
#      - "4317:4317"
#      - "4318:4318"
    environment:
      - LOG_LEVEL=debug
And here is the otel-collector-config.yml file, which tells Collector to relay trace data to Jaeger:
receivers:
  otlp:
    protocols:
      grpc:
        endpoint: 0.0.0.0:4317
      http:
        endpoint: 0.0.0.0:4318

exporters:
  debug: {}
  otlp/jaeger:
    endpoint: "http://jaeger:4317"
    tls:
      insecure: true

service:
  pipelines:
    traces:
      receivers: [otlp]
      exporters: [debug, otlp/jaeger]
    metrics:
      receivers: [otlp]
      exporters: [debug]
    logs:
      receivers: [otlp]
      exporters: [debug]
Note: although we are only interested in the traces, in the file above we declare the metrics and logs pipelines to avoid errors in the application when trying to send telemetry data. This is because, by default, OpenTelemetry auto-instrumentation in Spring Boot sends trace, metrics, and log data to the Collector. It should be possible to change the application configuration to send only traces, but we did not explore this possibility.
Automatic instrumentation - initial configuration
In each of the instrumented projects (services A and B), we perform the following configuration:
In build.gradle:
dependencyManagement {
  imports {
    mavenBom("io.opentelemetry.instrumentation:opentelemetry-instrumentation-bom:2.14.0")
  }
}

dependencies {
    // ...
    implementation("io.opentelemetry.instrumentation:opentelemetry-spring-boot-starter")
}
This configuration enables automatic instrumentation, which already provides several benefits:
-
Sending metrics, logs and traces to an OpenTelemetry Collector.
-
Context propagation: when the instrumented application invokes another service (in our case, through
RestTemplate), the trace ID is sent to the invoked service via some standardized HTTP header. -
The SQL queries performed are automatically collected.
By default, auto-instrumentation will send telemetry data using the gRPC protocol to the address http://localhost:4317. You can change the protocol with the otel.exporter.otlp.protocol property in the application.properties config file (the options are grpc and http/protobuf), while the Collector address (where the data is sent to) is configurable by the otel.exporter.otlp.endpoint property. More details in the OpenTelemetry SDK configuration documentation.
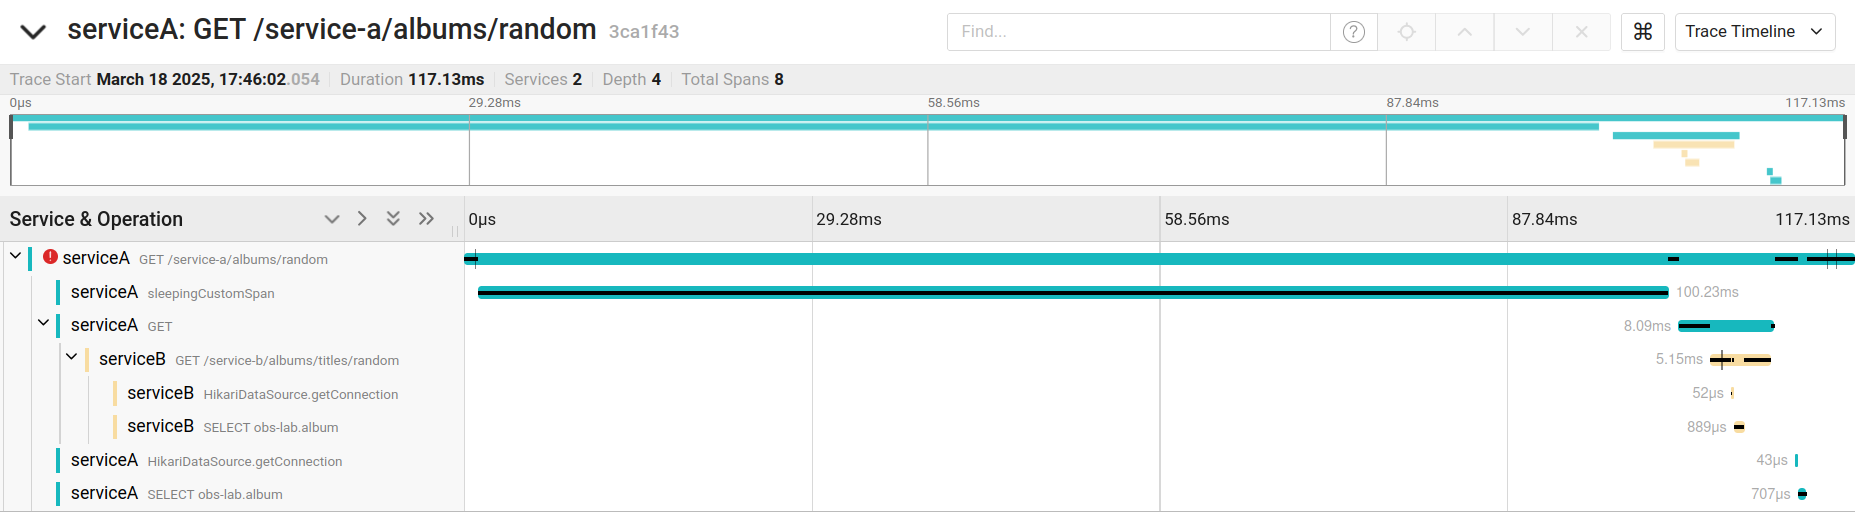
Trace timeline view in Jaeger
The figure below shows the trace timeline view offered by Jaeger. It is through this view that we will evaluate the instrumentation features offered by OpenTelemetry.
Invocation between services
Here is the code snippet from Service A that invokes Service B (no changes due to Otel):
@RestController
@Log4j2
public class ServiceAController {

    @Autowired
    private RestTemplate restTemplate; // we will simply use it

    // ....

    private String getRandomTitleFromServiceB() {

        String url = "http://localhost:8092/service-b/albums/titles/random";
        try {
            ResponseEntity<String> response = restTemplate.getForEntity(url, String.class);
            return response.getBody();
        } catch (HttpStatusCodeException e) {
            throw new IllegalStateException("Failed to get random album title from service B.");
        }
    }
}
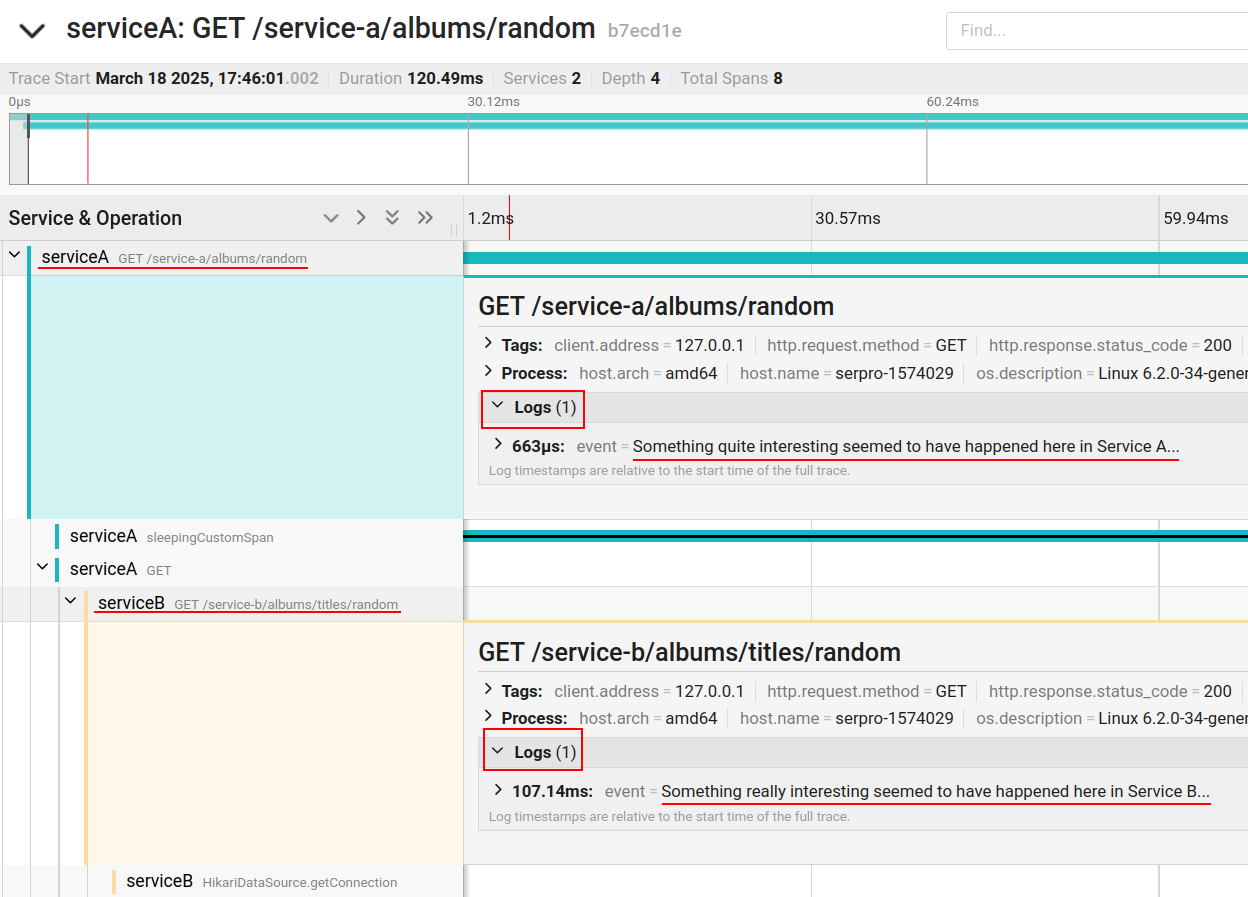
With just the initial instrumentation configuration, we have the propagation of context from one service to another, which allows us to see in the same trace the spans that occurred in different services. In addition, the trace timeline makes it clear that there was an invocation from service A to service B, as shown in the figure below.
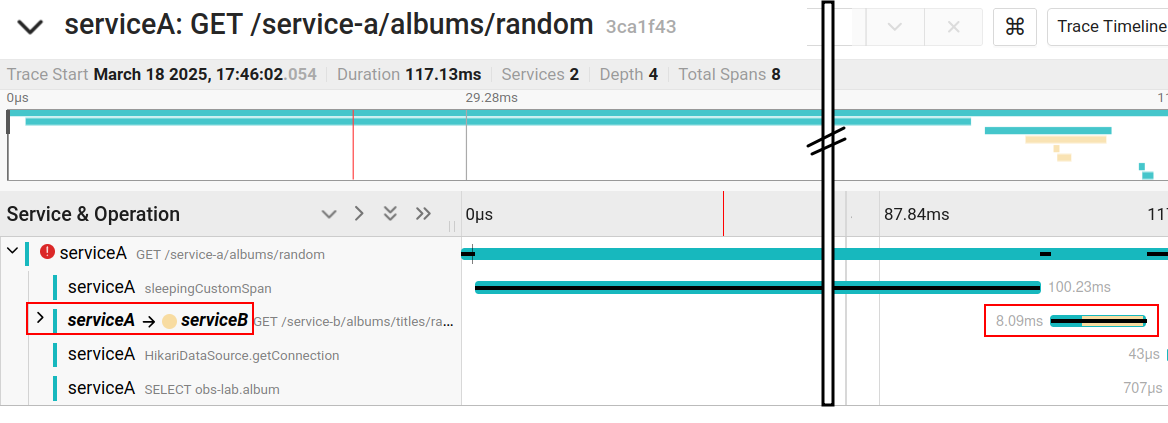
Note: the vertical bar with two lines in the figure represents a sign of discontinuity. That is: the original screenshot was cropped for better visualization.
We have also highlighted in Figure 4 the time spent on the invocation, which can be useful in detecting bottlenecks.
Integration with logs
At the beginning of the execution of each of our services, we create a log record, as follows:
import lombok.extern.log4j.Log4j2;

@RestController
@Slf4j
public class ServiceAController {

    // ...

    @GetMapping("/albums/random")
    public Album getRandomAlbum() {

        log.info("Something quite interesting seemed to have happened here in Service A...");
Note: when using the @Slf4j annotation from Lombok, we use Logback, which is the most recent logging system, successor to log4j, and the default for Spring Boot. Therefore, we do not recommend using the @Log4j2 annotation from Lombok.
In order for each log record to be linked to the corresponding span in the distributed trace, we need to make the following configuration in the src/main/resources/logback.xml file (add an appender that will process each log record):
<configuration>

    <appender name="CONSOLE" class="ch.qos.logback.core.ConsoleAppender">
        <encoder>
            <pattern>%d{yyyy-MM-dd HH:mm:ss} %-5level %logger Trace ID: %X{trace_id} Span ID: %X{span_id} - %msg%n</pattern>
        </encoder>
    </appender>

    <appender name="OPENTELEMETRY" class="leo.obslab.servicea.OtelLogAppender"/>

    <logger name="org.springframework.web.servlet.mvc.method.annotation.ExceptionHandlerExceptionResolver" level="ERROR"/>

    <root level="info">
        <appender-ref ref="CONSOLE"/>
        <appender-ref ref="OPENTELEMETRY"/>
    </root>
</configuration>
And also create the OtelLogAppender class, which adds each log record as an event of the current span:
import ch.qos.logback.core.AppenderBase;
import ch.qos.logback.classic.spi.ILoggingEvent;
import io.opentelemetry.api.trace.Span;

public class OtelLogAppender extends AppenderBase<ILoggingEvent> {

    @Override
    protected void append(ILoggingEvent event) {
        Span.current().addEvent(event.getFormattedMessage());
    }
}
This way, we can view the log records that occurred in different services in the same trace timeline view:
With the configuration in logback.xml inserting trace_id and span_id in the standard log pattern, we have another important effect which is to print the trace ID (and the span ID) in each log record written by the application (including stack traces), as in the example below:

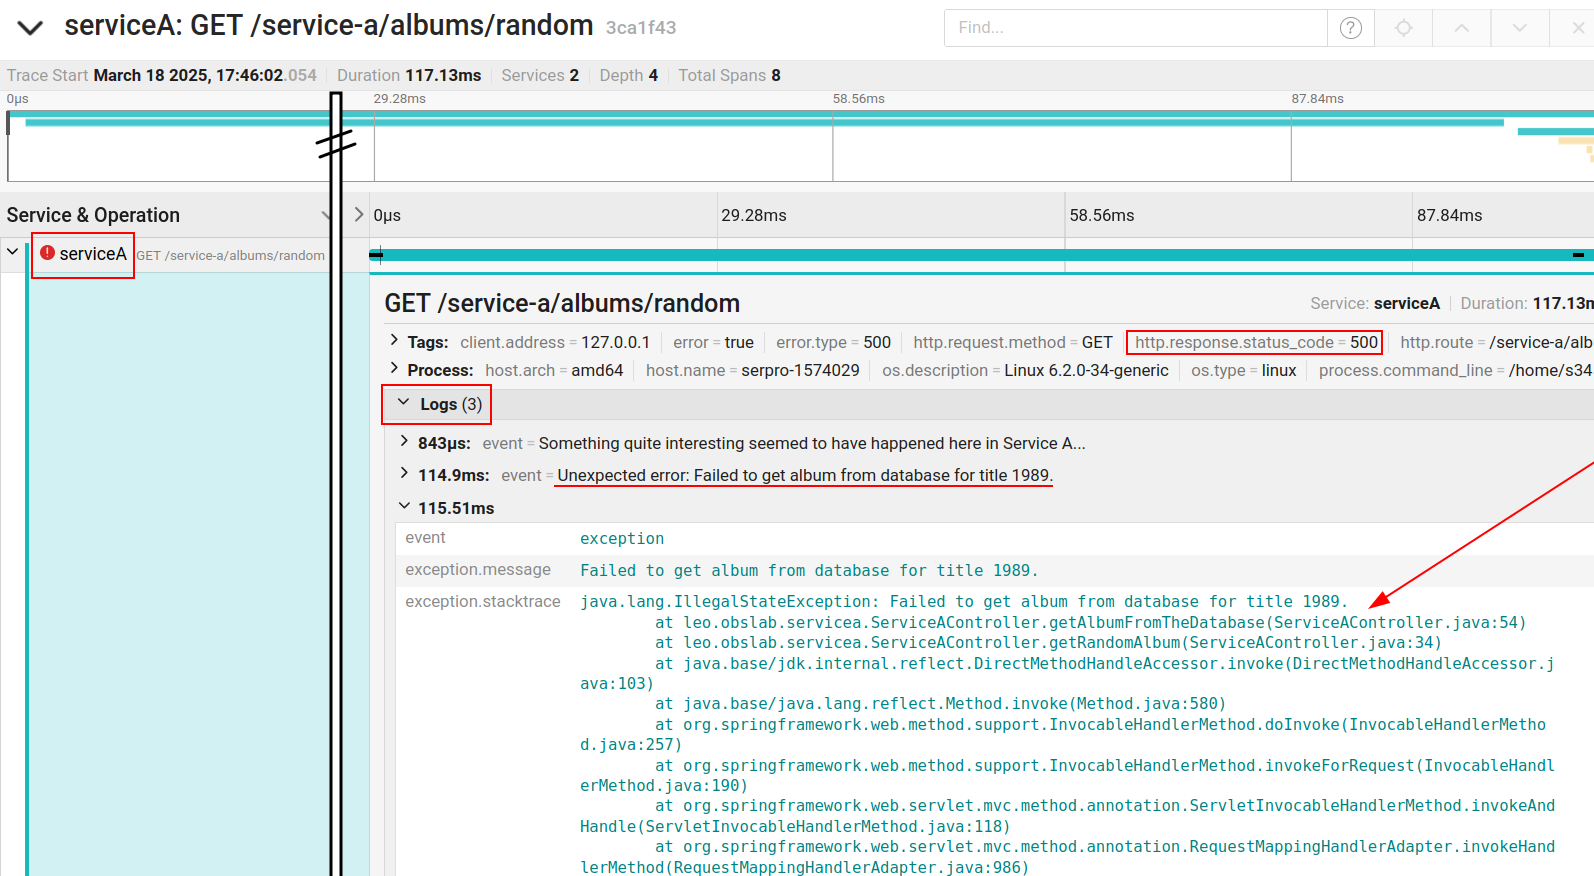
Integration with errors - stack trace attached to the trace
In order for the throwing of an internal error to be easily identified in the trace and for the stack trace to also be attached to the trace, it is necessary to capture the error in the exception handler:
import io.opentelemetry.api.trace.Span;
import io.opentelemetry.api.trace.StatusCode;

@ControllerAdvice
@Slf4j
public class ServiceAExceptionHandler {

    @ExceptionHandler(RuntimeException.class)
    public ResponseEntity<InternalErrorMessage> runtimeException(RuntimeException e, HttpServletRequest request) {

        log.error("Unexpected error: " + e.getMessage(), e);

        captureExceptionWithOtel(e); // here!

        InternalErrorMessage msg = new InternalErrorMessage();
        return ResponseEntity.status(HttpStatus.INTERNAL_SERVER_ERROR.value()).body(msg);
    }

    private void captureExceptionWithOtel(RuntimeException e) {
        Span span = Span.current();
        if (span != null && span.getSpanContext().isValid()) {
            span.recordException(e);
            span.setStatus(StatusCode.ERROR);
        } else {
            log.warn("No active span found to capture the exception.");
        }
    }

}
This way, we have the following result (a mark in the span indicating an error and the stack trace attached to this span):
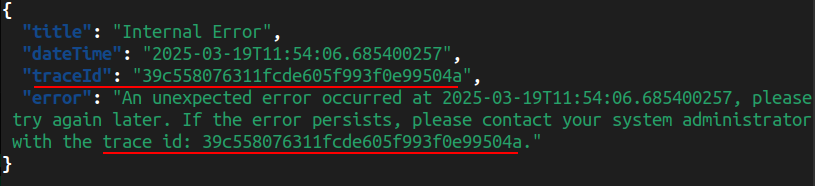
Trace ID in internal error messages
In addition to displaying the trace ID generated by OpenTelemetry in the log records, it is also important to return this trace ID in the internal error messages, so that tickets can be opened with the client providing us with the trace ID (and thus we can relate traces, logs and stack traces to the client’s problem).
To do this, we define the returned message in case of internal error as follows:
@Data
public class InternalErrorMessage {

	private final String title = "Internal Error";
	private final LocalDateTime dateTime = LocalDateTime.now();
	private final String traceId = TraceIdManager.getTraceId();
	private final String error = "An unexpected error occurred at " + dateTime
			+ ", please try again later. If the error persists, please contact your system administrator with the trace id: "
			+ traceId + ".";
}
Whereas the above trace ID is obtained from the following TraceIdManager:
import io.opentelemetry.api.trace.Span;

public class TraceIdManager {

	public static String getTraceId() {
		Span currentSpan = io.opentelemetry.api.trace.Span.current();
		return currentSpan.getSpanContext().getTraceId();
	}
}
So, when an internal error occurs, the client has access to this trace ID, as shown in the response example below:
SQL queries
With just the initial instrumentation configuration, we have the instrumentation of the SQL queries performed by the application. Thus, each access to the database is explicit as a span in the trace, as shown in the figure below. One really cool thing is that we can easily see the executed SQL code.
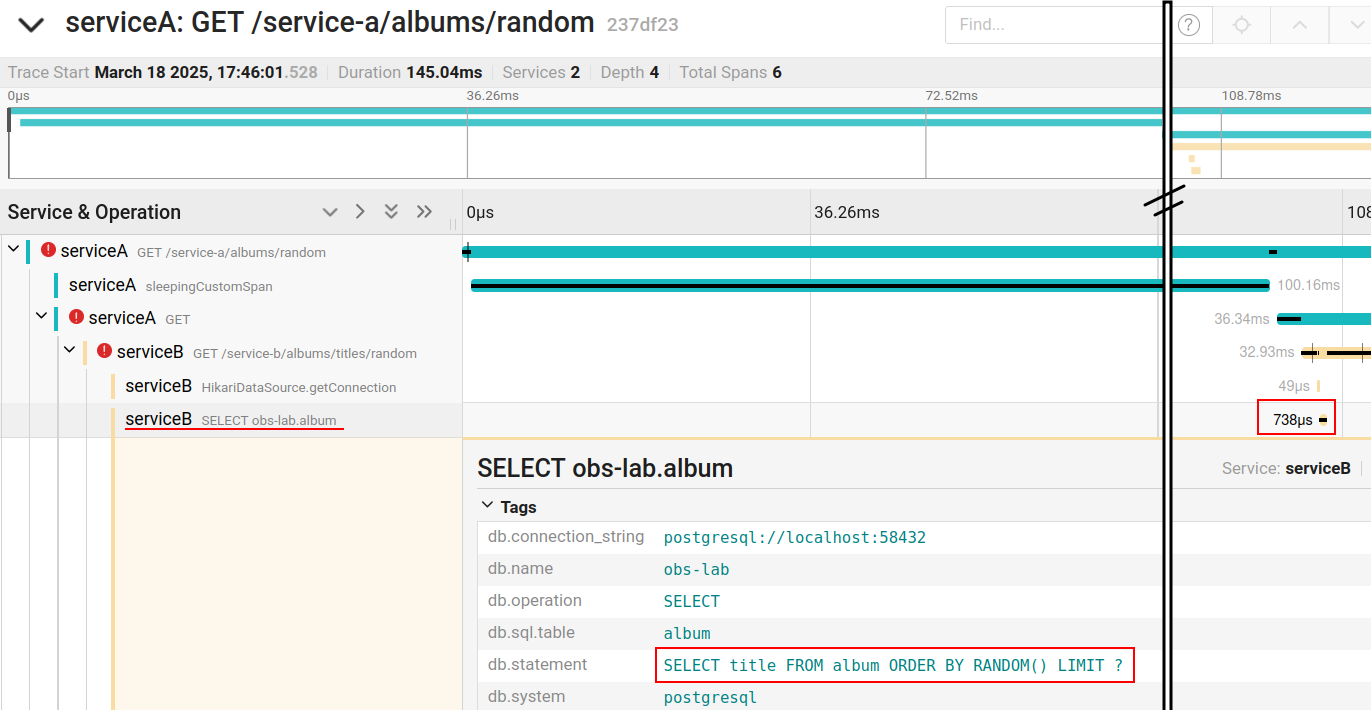
As you can see in the figure, we also have the execution time of the SQL query, which is very important for detecting performance bottlenecks in the application.
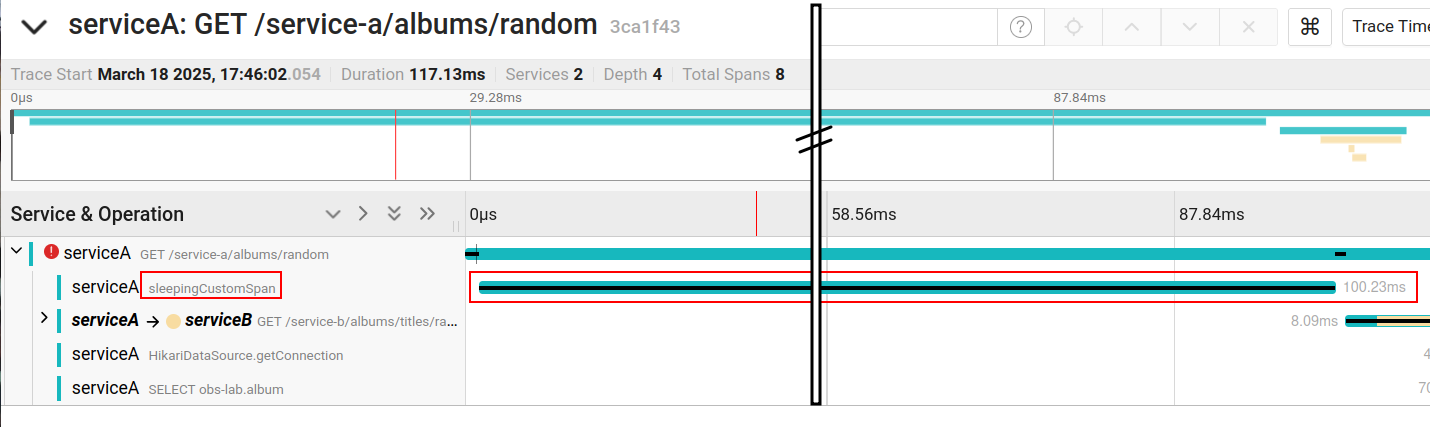
Custom span
To highlight a section of code in the trace as a span in a customized way, we can annotate the method to be highlighted with @WithSpan, as follows:
@Component
public class Sleeper {

    @WithSpan("sleepingCustomSpan") // here!
    public void sleepWithCustomSpan() {

        try {
            Thread.sleep(100);
        } catch (InterruptedException e) {
            throw new IllegalStateException("It should never happen while sleeping.", e);
        }
    }

}
This component is normally used by the controller:
@RestController
@Slf4j
public class ServiceAController {

    // ...

    @Autowired
    private Sleeper sleeper;

    @GetMapping("/albums/random")
    public Album getRandomAlbum() {

        // ...

        sleeper.sleepWithCustomSpan();

        // ...
    }

}
The result is the visualization of the “sleepingCustomSpan” span (including its duration) in the trace:
Regarding the use of the @WithSpan annotation, a warning: this annotation works with the Spring Boot aspects framework, so that only “proxified” methods by the framework can be annotated in this way. In other words, the method with @WithSpan must be public and invoked from another bean (i.e., it cannot be private or public, but called within the same class). If you want to generate a custom span for a more specific piece of code, there is the programmatic option, which would be something like this (we have not tested it):
Span span = tracer.spanBuilder("sleepingCustomSpan").startSpan();
Thread.sleep(100);
span.end();
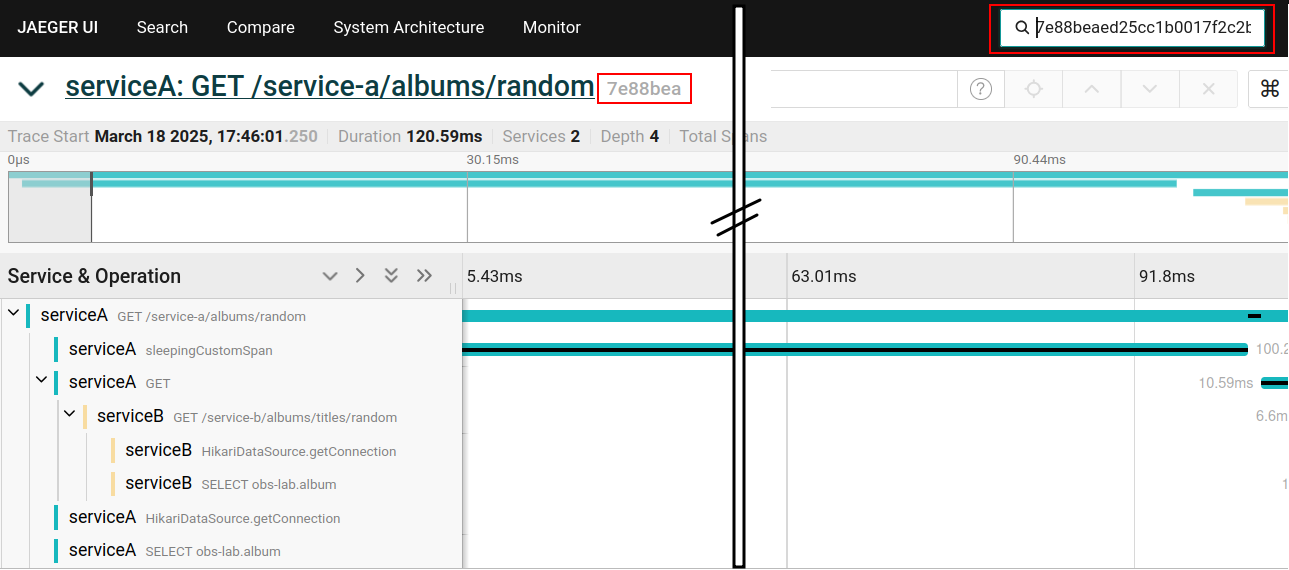
Finding a trace in Jaeger by trace ID
Given a trace ID, we can easily find its corresponding trace in Jaeger using a search box at the top of the page.
Architectural considerations about the Collector (concerns about resilience and performance)
With or without Collector?
Why having a Collector? After all, it would be possible and easy to have the application (instrumented with Otel) send data directly to Jaeger.
Well. Consider the communication between the application and the Otel Collector. At this point, the client (in our application) sends data to the Collector server. What happens if this communication is slow? Will it slow down our application? What happens if this communication fails? Will events be lost?
Well, the Otel client has resilience mechanisms (basically asynchronous batch sending, timeouts and resending). Mainly due to the asynchronicity of the sending (the main threads of the application are not blocked), the impact on the application is mitigated (but let’s consider here that some impact is still possible). And these mechanisms applies both to sending to the Collector as to sending directly to a backend like Jaeger.
But with OpenTelemetry, we can send telemetry data not just to one, but to multiple backends. Let’s say we’re going to send traces to Jaeger and Grafana Tempo, and also send logs to Loki. In this case, the problems of communication failures multiply. When we send everything to the Collector, there is only one communication channel that can compromise the application’s performance. With multiple communication channels, the situation has more chances to get worse.
And there is another issue of maintainability. The choice of backend is not trivial: should we use Jaeger, OpenZipkin or Grafana Tempo to view the traces? Let’s say that all the services in the system have Otel instrumentation connected directly to Jaeger. If we want to change our visualization tool to Tempo, we will have to perform maintenance on all the services. Having Collector in the middle, we only need to reconfigure the Collector, without disturbing the various development teams that maintain the different services.
Remote Collector vs. local Collector
And there is one more point to consider about the Collector: it can run collocated to the service (a sidecar). This is very interesting from a resilience point of view, as we ensure extremely efficient communication between the service and the Collector, immediately releasing the service connection and preventing network problems from this communication from affecting the service. Later, if the Collector has problems sending data to the backend, this may have less of an impact on the operation of the instrumented service.
However, if we consider that the network resources are still shared (between the application and the local Collector) and that the Otel client already has non-blocking asynchronous sending, then perhaps the gain in resilience brought by the local Collector is minimal.
And there are still other factors that work against the local Collector. If the service pod goes down (it happens), telemetry data losses may occur. But this disadvantage may not be so significant, since the same thing can happen with the remote Collector: the application is having trouble sending data to the Collector and before it can resend it, the pod dies and data is lost.
The biggest disadvantage of the Collector on localhost is then, depending on the context, the viability of its deployment collocated with the service. In some contexts, developers will not have the autonomy to do so and will need a good partnership with the infrastructure area. In a cloud context, where pods die all the time, it is necessary to ensure that the deployment of the Collector on localhost is automated together with the creation of the pod that hosts the service. Another possible difficulty is updating the Collector configuration if necessary. Therefore, it is necessary to evaluate each specific situation.
Conclusions
We configured our Spring Boot services to work with OpenTelemetry instrumentation by sending data to the Otel Collector, which in turn passes this data to Jaeger. This way, we can use Jaeger to visualize our distributed traces, having visibility of:
- invocations between services in the trace view,
- logs in the context of their respective spans in the trace view,
- errors and stack traces in the trace view,
- custom spans in the trace view,
- SQL queries executed in the trace view,
- trace ID in log records, and
- trace ID in internal error messages.
Finally, we outlined some considerations about architectural choices involving the use of the OpenTelemetry Collector. We conclude that the use of the Collector brings advantages. However, using the local Collector typically brings challenges that do not compensate for any eventual marginal benefit in terms of resilience when compared to the remote Collector.